


Want more housing market stories from Lance Lambert’s ResiClub in your inbox? Subscribe to the ResiClub newsletter.
During the pandemic housing boom, housing demand was running so hot—and homes sold so quickly—that listings barely even registered as active inventory. Indeed, in February 2022, there were only 346,511 active homes for sale, according to Realtor.com’s data series. That was a staggering 68.5% below the 1,102,660 active listings in February 2019.
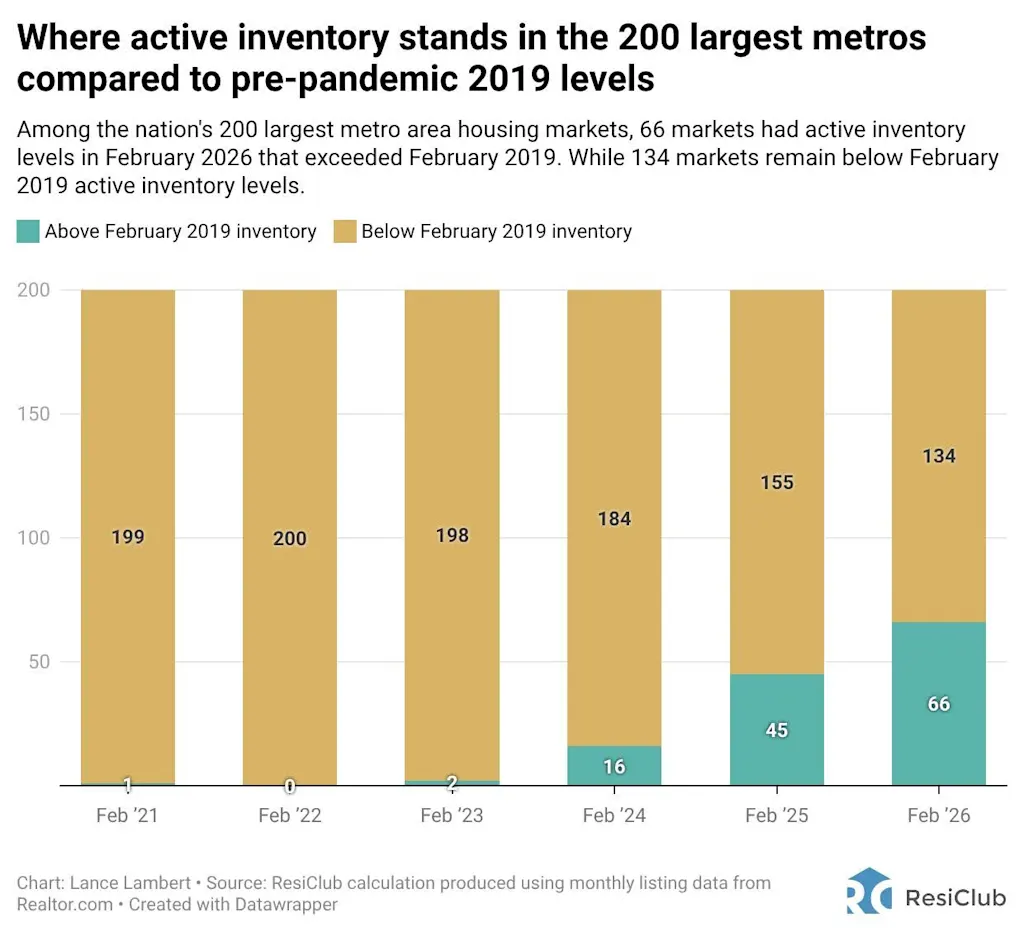
At the end of February 2022, not a single one of America’s 200 largest housing markets had more inventory than in pre-pandemic February 2019.
Fast-forward to the end of February 2026, and there were 914,860 active homes for sale—and now 66 of the nation’s 200 largest housing markets have more active inventory than they did in pre-pandemic February 2019.
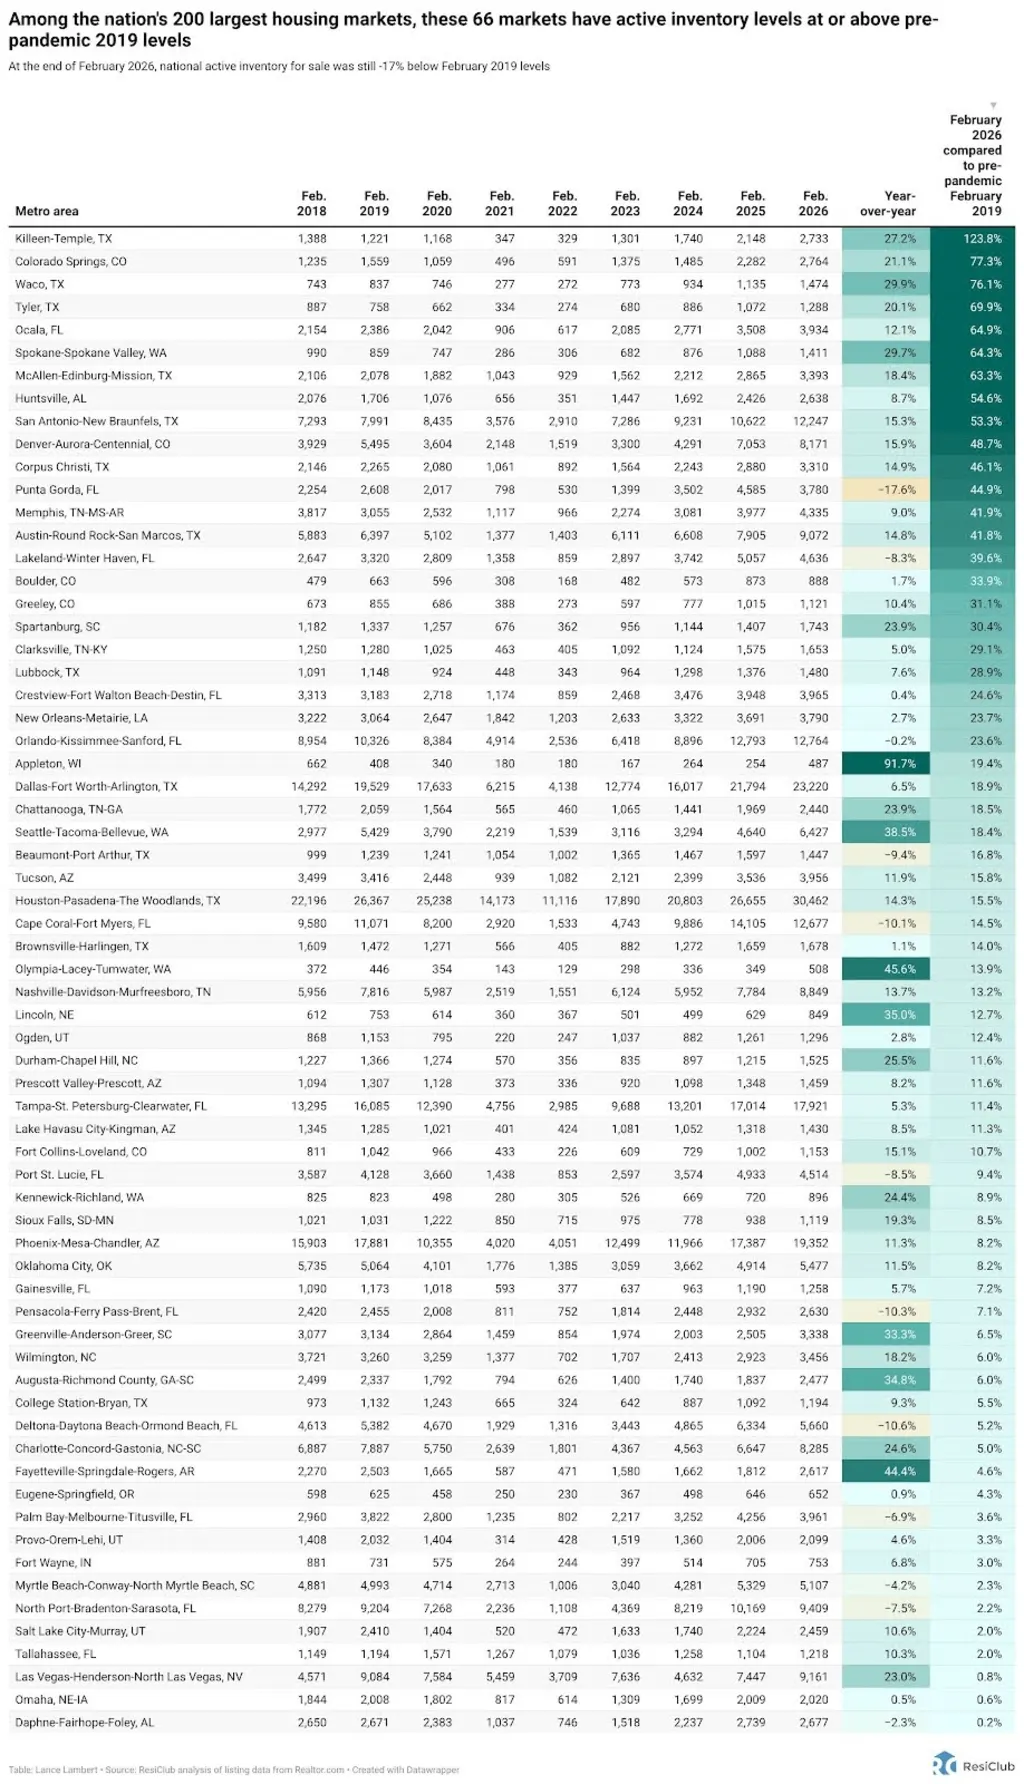
Among the nation’s 200 largest housing markets, the table below shows the 66 markets where active housing inventory for sale at the end of February 2026 exceeded the levels those respective markets had in February 2019.
(Click here for a sortable version of the table below.)
Many of the softest housing markets over the past few years, where homebuyers have gained more leverage, are located in the South and Mountain West regions. These areas were among the nation’s top pandemic boomtowns, having experienced significant home price growth during the pandemic housing boom, which stretched housing fundamentals far beyond local income levels.
When pandemic-fueled migration slowed and mortgage rates spiked, markets like Cape Coral, Florida, and Austin, Texas, faced challenges, as they had to rely on local incomes to sustain frothy home prices. The housing market softening in these areas was further accelerated by the abundance of new home supply in the pipeline across the Sunbelt.
Builders are often more willing to reduce net effective prices or make other affordability adjustments to move product in a shifted market. Those adjustments in the new construction market then create an additional cooling effect on the resale market, as some buyers who might have opted for an existing home shift their focus to new homes where deals are still available.
In contrast, many Northeast and Midwest markets were less reliant on pandemic migration and have less new home construction in progress. With lower exposure to that demand shock, active inventory in these Midwest and Northeast regions has remained relatively tighter, keeping the advantage in the hands of home sellers (at least relatively speaking).
We should point out that national active housing inventory growth on a year-over-year basis continues to decelerate—and many of the weakest housing markets in Florida are now seeing mild year-over-year declines in active inventory.
ResiClub members can see our latest inventory analysis for over 800 metro areas and 3,000 counties here. ResiClub Terminal members can go even deeper here.
window.addEventListener(“message”,function(a){if(void 0!==a.data[“datawrapper-height”]){var e=document.querySelectorAll(“iframe”);for(var t in a.data[“datawrapper-height”])for(var r,i=0;r=e[i];i++)if(r.contentWindow===a.source){var d=a.data[“datawrapper-height”][t]+”px”;r.style.height=d}}});
Generally speaking, housing markets where inventory (i.e., active listings) has returned to pre-pandemic 2019 levels have experienced weaker home price growth (or outright declines) over the past 45 months. Conversely, housing markets where inventory remains far below pre-pandemic 2019 levels have, generally speaking, experienced stronger home price growth over the past 45 months.
While this data cut will become less useful over time, it remains useful right now
One of the common pushbacks I hear when comparing today’s active inventory for sale with 2019 levels is that some markets—like Austin and Punta Gorda, Florida—have larger populations now than they did back in 2019.
It’s true that some of the markets with higher inventory today compared with 2019 are also the ones that have experienced notable population growth in recent years. However, that actual population growth (i.e., a larger population base) isn’t the primary reason inventory has jumped so quickly in places like Austin and Punta Gorda after the pandemic housing boom ended.
Rather, it’s because those markets have experienced a sharper weakening in their for-sale market since the pandemic housing boom fizzled out, and that has helped push up unsold inventory in those markets.
This dynamic isn’t unusual. Growth markets that run hotter during housing booms often experience more pronounced cyclical cooling on the back end. As is often the case, stretched fundamentals, decelerated domestic migration, and elevated levels of new construction coming online—combined with an affordability-shifted market—collectively drive a larger supply-demand equilibrium shift.
That said, over time, changes in market size—specifically population and total households—will naturally affect what constitutes a “normal” level of active inventory in higher growth markets (like the Dallas metro area). By 2035, for example, comparing active inventory to 2019 levels will be far less meaningful than it has been in 2021 to 2026.
