


Want more housing market stories from Lance Lambert’s ResiClub in your inbox? Subscribe to the ResiClub newsletter.
National home prices rose +0.1% year-over-year between October 2024 and October 2025, according to the Zillow Home Value Index reading published last week—a decelerated rate from the +2.4% year-over-year rate between October 2023 and October 2024.
In the first half of 2025, the number of major metro area housing markets seeing year-over-year declines climbed. That count has since stopped ticking up.
—> 31 of the nation’s 300 largest housing markets (i.e., 10% of markets) had a falling year-over-year reading in the January 2024 to January 2025 window.
—> 42 of the nation’s 300 largest housing markets (i.e., 14% of markets) had a falling year-over-year reading in the February 2024 to February 2025 window.
—> 60 of the nation’s 300 largest housing markets (i.e., 20% of markets) had a falling year-over-year reading in the March 2024 to March 2025 window.
—> 80 of the nation’s 300 largest housing markets (i.e., 27% of markets) had a falling year-over-year reading in the April 2024 to April 2025 window.
—> 96 of the nation’s 300 largest housing markets (i.e., 32% of markets) had a falling year-over-year reading in the May 2024 to May 2025 window.
—> 110 of the nation’s 300 largest housing markets (i.e., 36% of markets) had a falling year-over-year reading in the June 2024 to June 2025 window.
—> 105 of the nation’s 300 largest housing markets (i.e., 36% of markets) had a falling year-over-year reading in the July 2024 to July 2025 window.
—> 109 of the nation’s 300 largest housing markets (i.e., 35% of markets) had a falling year-over-year reading in the August 2024 to August 2025 window.
—> 105 of the nation’s 300 largest housing markets (i.e., 35% of markets) had a falling year-over-year reading in the September 2024 to September 2025 window.
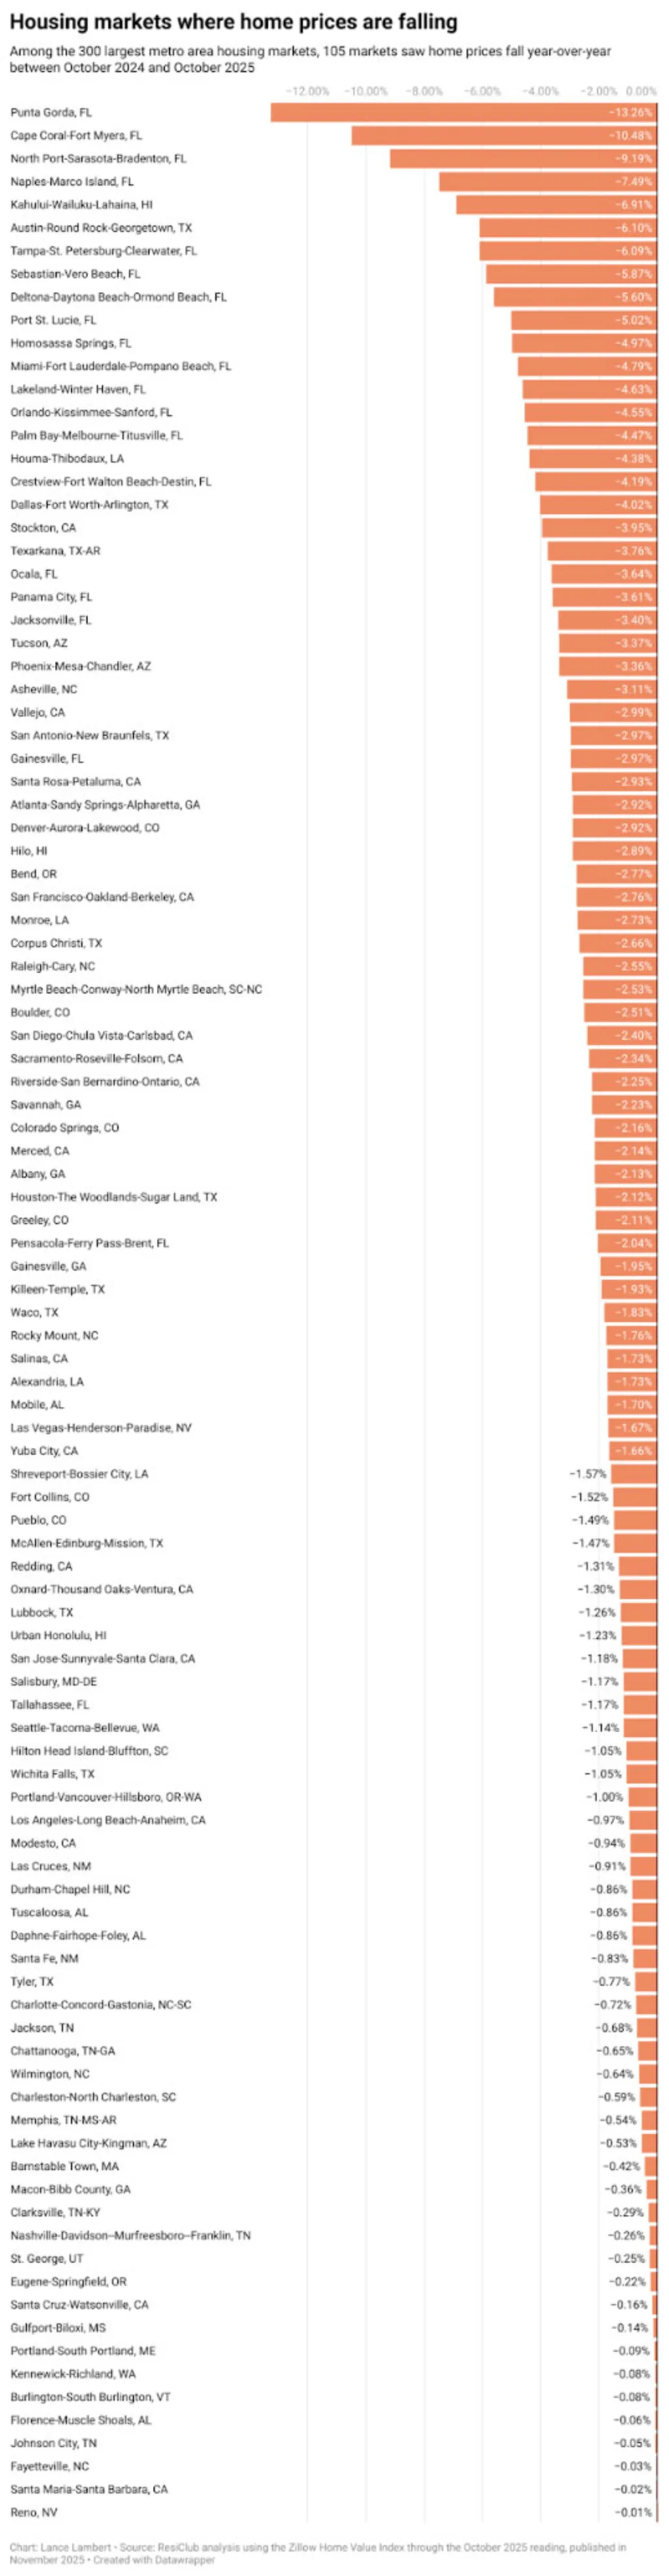
—> 105 of the nation’s 300 largest housing markets (i.e., 35% of markets) had a falling year-over-year reading in the October 2024 to October 2025 window.
Earlier this year, an increasing number of housing markets slipped into year-over-year price declines as the supply-demand balance gradually tilted more toward buyers. But in recent months, the list of declining markets has begun to stabilize as inventory growth has stalled.
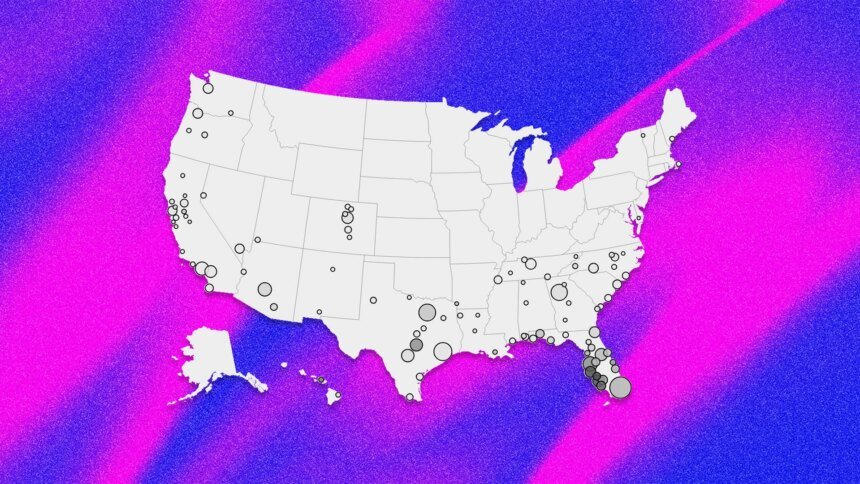
Home prices are still climbing in many regions where active inventory remains well below pre-pandemic 2019 levels, such as pockets of the Northeast and Midwest. In contrast, some pockets in states like Arizona, Texas, Florida, and Colorado—where active inventory exceeds pre-pandemic 2019 levels—are seeing modest home price pullbacks.
Many of the housing markets seeing the most softness, where homebuyers have gained the most leverage, are primarily located in Sun Belt regions, particularly the Gulf Coast and Mountain West.
Many of these areas saw major price surges during the Pandemic Housing Boom, with home price growth outpacing local income levels. As pandemic-driven domestic migration slowed and mortgage rates rose, markets like Tampa and Austin faced challenges, relying on local income levels to support frothy home prices.
This softening trend is further compounded by an abundance of new home supply in the Sun Belt. Builders are often willing to lower prices or offer affordability incentives to maintain sales, which also has a cooling effect on the resale market. Some buyers, who would have previously considered existing homes, are now opting for new homes with more favorable homebuilder deals.
Of course, while 105 of the nation’s 300 largest metro area housing markets are seeing year-over-year home price declines, another 195 are still seeing year-over-year home price increases.
Where are home prices still up on a year-over-year basis? See the map below.
The final deadline for Fast Company’s World Changing Ideas Awards is Friday, December 12, at 11:59 p.m. PT. Apply today.
