


Want more housing market stories from Lance Lambert’s ResiClub in your inbox? Subscribe to the ResiClub newsletter.
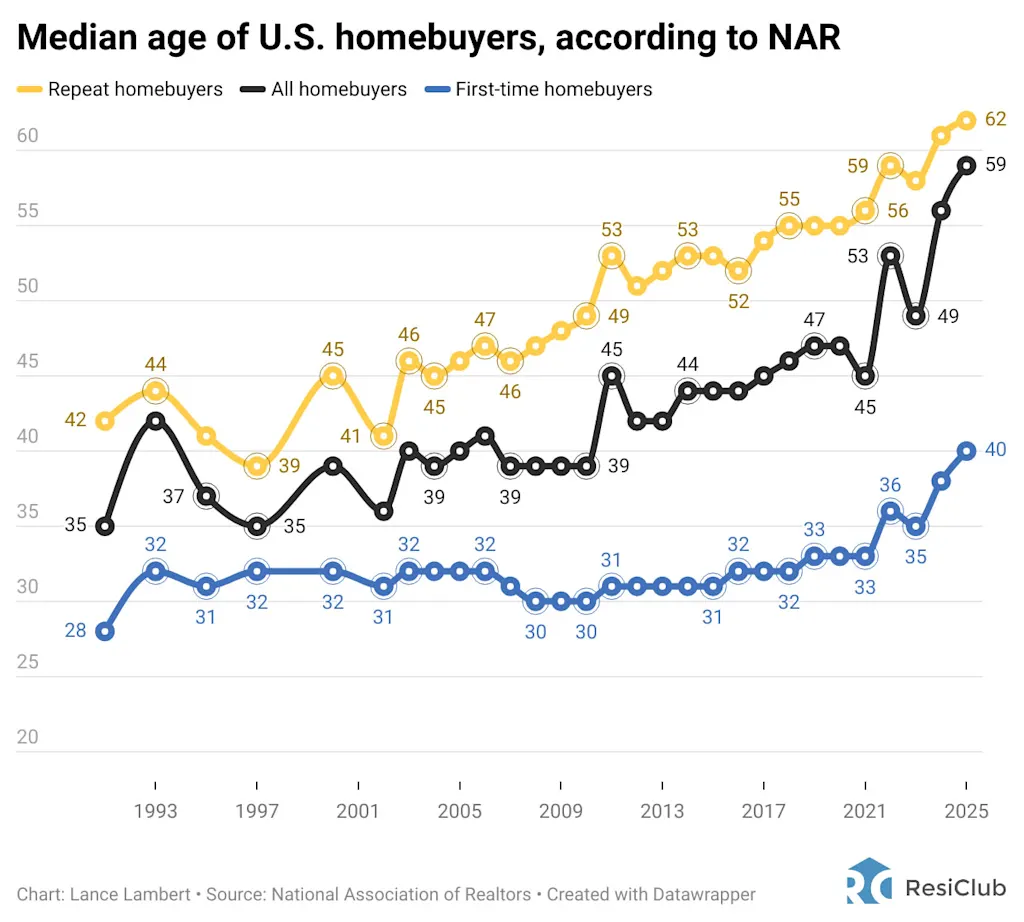
Earlier this month, the National Association of Realtors (NAR) released its annual survey, which found that the median age of first-time U.S. homebuyers in 2025 climbed to 40. That’s up from 38 in 2024—and far above the median age in 1992, when it was 28.
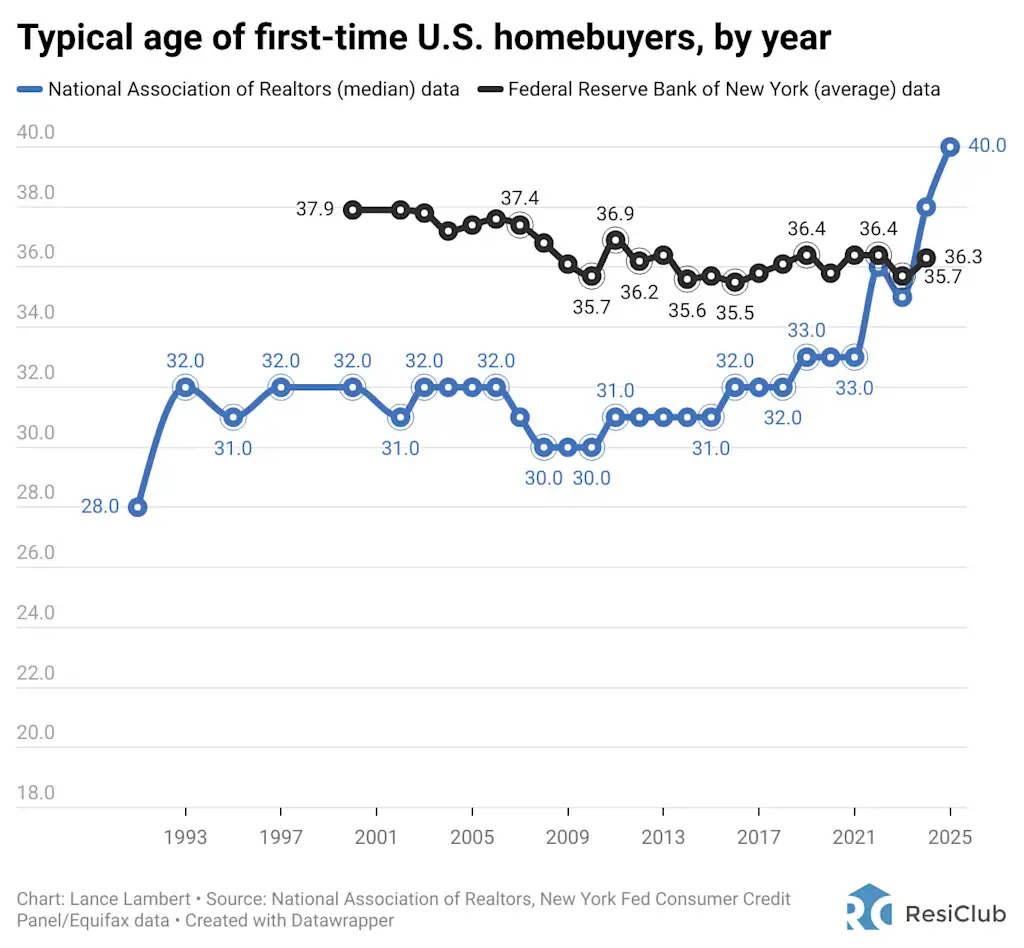
At first glance, it appears that deteriorating housing affordability—driven by the Pandemic Housing Boom and the 2022 mortgage-rate shock—has pushed the age of first-time buyers higher. However, when you look across other data sources, including the Federal Reserve Bank of New York and the U.S. Census Bureau, you don’t see the same spike.
ResiClub dug deeper into the data to figure out what’s really going on.
According to the Federal Reserve Bank of New York, the average first-time homebuyer in 2024 was 36.3 years old—just a little younger than NAR’s estimate of the median first-time homebuyer age of 38 in 2024.
Initially, one might suspect the difference simply stems from the fact that the New York Fed reports an “average” while NAR reports a “median.” However, when you peel back the onion, you’ll see there’s a large historical divergence between the two organizations’ figures.
That raises the question: How did they each collect their data?
The NAR data series is calculated by an annual survey. For this year’s survey, NAR mailed out a 120-question survey to 173,250 recent homebuyers. The recent homebuyers had to have purchased a primary residence home between July 2024 and June 2025. In total, 6,103 responses were received this year.
The New York Fed doesn’t collect its data by survey. Instead, it’s looking at credit report data, which it says has “5% of nationally representative individuals since 1999.”
Back in August, ResiClub emailed both NAR and the New York Fed to get their thoughts on the first-time homebuyer data divergence.
Jessica Lautz, NAR’s deputy chief economist, told ResiClub on August 14:
“The Federal Reserve is basing their data on credit data. The Profile of Home Buyers and Sellers [from NAR] is based on a survey of those who purchased a primary residence home in the last year. Thus, the NAR survey includes the 9% of first-time buyers who paid cash for their home and did not finance their purchase. Excluded are first-time buyers who purchased a vacation home or mom-and-pop rental as their first purchase. A trend which has popularized as young adults are unable to achieve homeownership in the expensive areas they may live in. The NAR data collection is mid 2023 to mid 2024 vs. a calendar year. Lastly, NAR uses medians as a measure of central tendency vs. average.”
Donghoon Lee, an economic research adviser in microeconomics at the Federal Reserve Bank of New York, told ResiClub on August 13:
“We can’t tell you how the NAR annual survey was constructed, but in our previous blog, we wrote about a comparison between our data and NAR source.
Here are some of the unsophisticated differences.
- New York Fed Consumer Credit Panel is a panel of credit report data where we follow 5% of nationally representative individuals since 1999, and is not a survey. We are not subject to any low response rate issue of the respondents.
- We identify first-time homebuyers when a mortgage account appears for the first time on the individual’s credit reports. If a home purchase was made without a mortgage (such as a cash purchase) then we don’t see them, and not included in calculating the statistics.”
My takeaway? I’m going to take this particular first-time homebuyer data—especially the NAR series—with a grain of salt going forward. Instead, I’ll lean more on generational homeownership rates by age. And when you look at those figures, they clearly confirm that younger generations are entering homeownership more slowly than their older peers.
ResiClub also messaged Apartment List to get its latest calculation. See below:
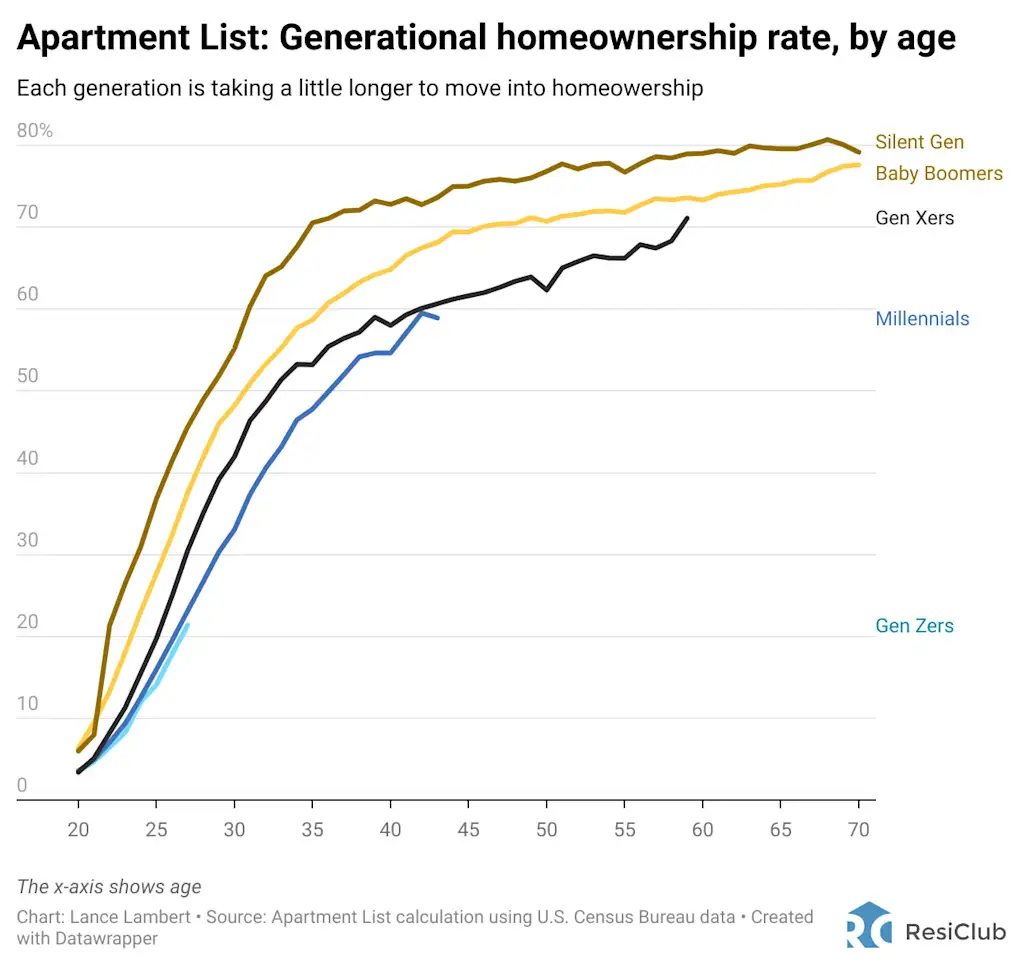
Apartment List’s analysis shows that with each successive generation, homeownership rates take longer to ramp up. This pattern isn’t unique to Gen Z—baby boomers were slower to reach key homeownership milestones than the Silent Generation, Gen X was slower than the boomers, millennials were slower than Gen X, and Gen Z is slower still.
The fact that each generation takes a little longer to enter homeownership—during both periods of “good” and “poor” housing affordability—suggests an underlying secular shift that isn’t just driven by affordability. In my view, that secular shift largely comes down to lifestyle/cultural shifts.
With each new generation, Americans are spending more years in school, marrying later, having children later (and having fewer kids), and ultimately buying homes later. I call this phenomenon “lifestyle delays.”
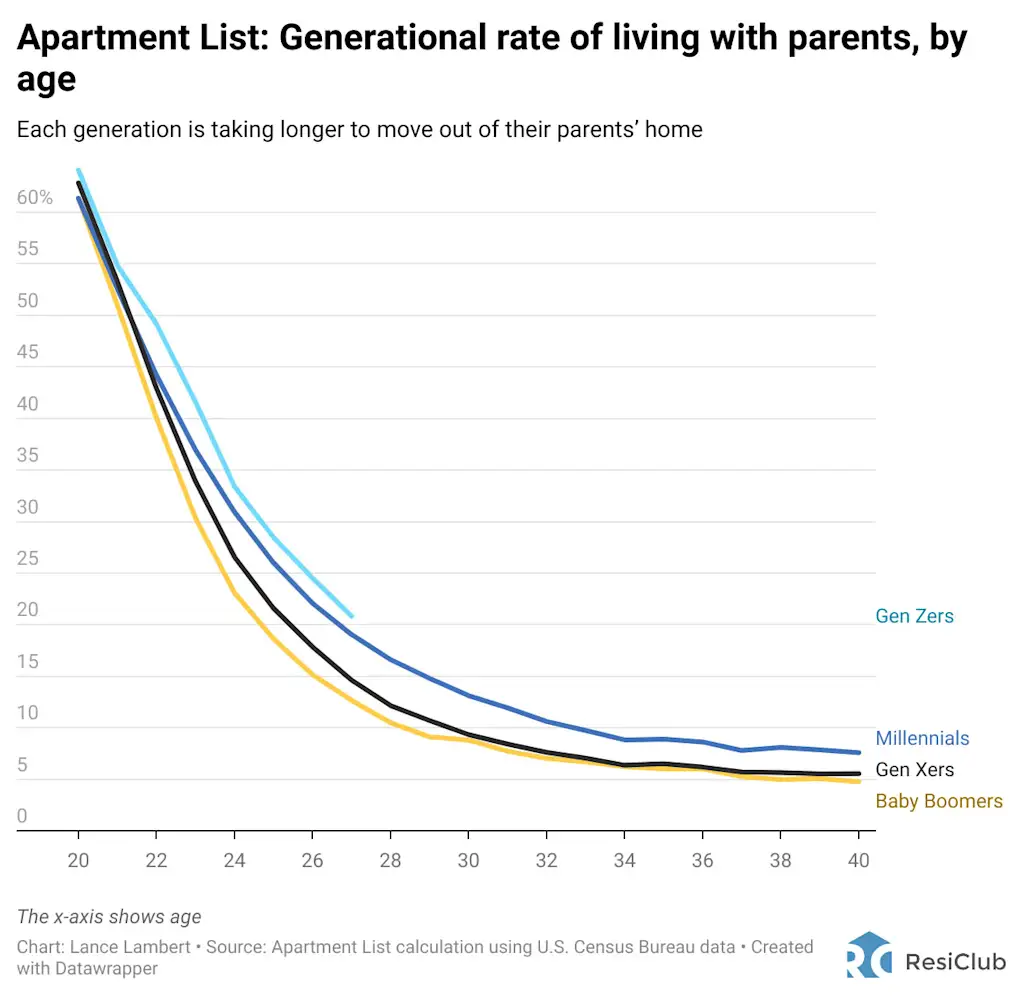
Given how homeownership rates are calculated (the number of owner-occupied housing units divided by the total number of occupied housing units), it’s likely that the gradual slowdown in homeownership by generation is actually understating the true drop-off.
In plain English, what do I mean? If someone in their twenties or thirties is still living with their parents, they technically aren’t counted as their own household and therefore aren’t included in the denominator. And when you look closely at the generational data (see the Apartment List analysis above), you’ll note that with each generation, Americans are taking longer to move out of their parents’ homes.
If you adjust for this, the “real” homeownership rates by generation—something John Burns Research and Consulting has analyzed—you find that the generational homeownership drop-off is indeed larger than the headline data suggests.
The final deadline for Fast Company’s World Changing Ideas Awards is Friday, December 12, at 11:59 p.m. PT. Apply today.
