


Want more housing market stories from Lance Lambert’s ResiClub in your inbox? Subscribe to the ResiClub newsletter.
Florida’s particularly intense overheating during the Pandemic Housing Boom is the key reason for its downside pricing vulnerability. While U.S. home prices rose +41% between March 2020 and June 2022, Florida home prices surged +51% over the same period—leaving some parts of the state significantly overvalued. Only, it takes a large enough shift in the supply-demand equilibrium for that vulnerability to manifest into falling prices.
Of course, over the past three years, 5 factors have come together to create a supply-demand equilibrium shift large enough to reveal some of that downside risk and push certain pockets of Florida into post-Pandemic Housing Boom corrections.
- The Pandemic Housing Boom’s migration surge to Florida has fizzled out. Indeed, Florida saw net domestic migration of +23K in 2025, compared to +314K in 2022. Without that larger influx of deep-pocketed buyers from up North, Florida home prices have had to rely more on local incomes.
- Surfside condo fallout. Following the Surfside condo collapse in June 2021, which killed 98 people, Florida passed new structural safety rules, requiring more inspections and additional funds for repairs to be set aside by the end of 2024. That has led to Florida HOAs issuing sky-high special assessments and monthly HOA fee increases to cover these costs. This has had a greater impact on older coastal Florida condo buildings.
- Hurricane Ian spurred a greater SWFL softening. Markets like Cape Coral and Punta Gorda, which were hard-hit by Hurricane Ian in September 2022, saw thousands of damaged homes, and the subsequent need for renovations. According to the National Oceanic and Atmospheric Administration, Hurricane Ian caused an estimated $112.9 billion worth of total damage, making Ian the third-costliest U.S. hurricane on record. That event helped create additional softening in SWFL.
- Supply elasticity. Unlike many housing markets in the Northeast and Midwest, Florida has a higher level of homebuilding and multifamily construction. As that new supply entered the market in the post-Pandemic Housing Boom affordability-strained environment, builders used bigger affordability adjustments—such as mortgage rate buydowns and price cuts—where needed to move it. That helped cool the Florida resale market further by drawing buyers who might have otherwise purchased existing homes toward new construction. As a result, this put additional upward pressure on Florida’s resale inventory after the Pandemic Housing Boom ended.
- Home insurance shocks. Over the past three years, the median annual U.S. home insurance premium has jumped around 30%, but Florida homeowners have been hit even harder. The surge in Florida home insurance rates is partly driven by rising replacement costs—home prices and construction costs soared during the boom—and partly by increased hurricane risks and insurance payouts. Florida’s sharp rise in insurance costs, combined with one of the biggest home price increases during the Pandemic Housing Boom, has led to one of the biggest housing affordability deteriorations.
Everything above, ResiClub has detailed closely over the past few years—and when I was working at Fortune Magazine back in spring 2022 I detailed why Florida had elevated risk of a Pandemic Housing Boom correction.
Let’s shift from the backward-looking drivers and examine what the real-time inventory and pricing indicators across Florida are telling us about the next phase of the state’s housing cycle.
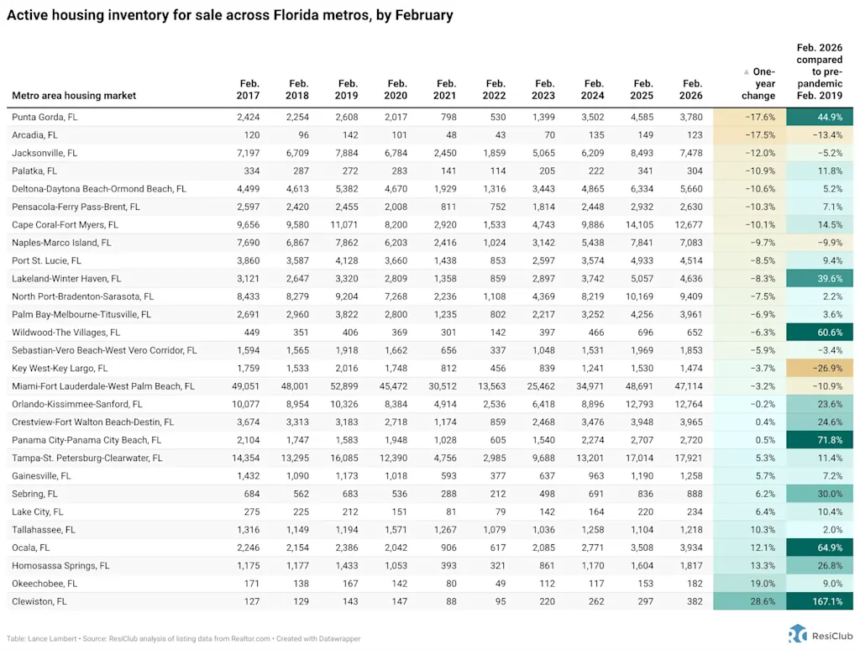
While active housing inventory is still rising in most U.S. housing markets on a year-over-year basis, the pace of growth continues to decelerate across much of the country. In fact, Florida—home to many of the weakest regional housing markets over the past two years—is now seeing active inventory edge down slightly year-over-year (-4%).
What’s interesting is that many of Florida’s housing markets where home prices have fallen the most during the post-Pandemic Housing Boom recalibration period—including Punta Gorda and Cape Coral—are currently seeing some of the largest year-over-year declines in active inventory for sale. The fact that inventory isn’t bursting upward anymore in Punta Gorda and Cape Coral, and is actually declining somewhat, suggests that those markets may slowly be finding their footing and, at the very least, that the intensity of their corrections is easing.
Click here for an interactive of the chart below

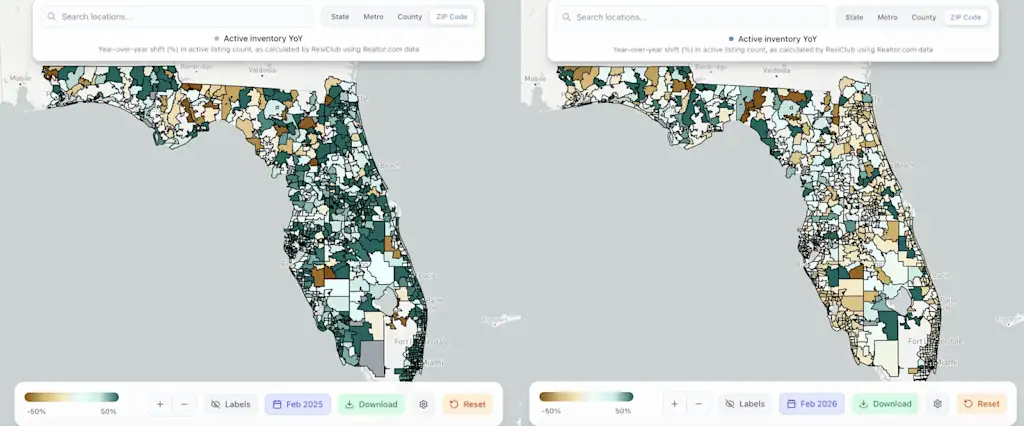
In the side-by-side maps below you can clearly see that the inventory burst in Southwest Florida—arguably the epicenter of U.S. housing market weakness over the past 24 months—is no longer happening. Indeed, most ZIP Codes in SWFL are down a little year-over-year for active inventory.
The screenshots below are pulled from the ResiClub Terminal.
LEFT: Year-over-year shift in active housing inventory for sale between Feb. 2024 to Feb. 2025
RIGHT: Year-over-year shift in active housing inventory for sale between Feb. 2025 to Feb. 2026
Big picture: Softness—and even outright weakness—remains across many parts of Florida’s housing market. However, the intensity of the downturn in Florida has eased somewhat in recent months.
ResiClub members who’d like to view our deep dive into Florida housing markets, should go here.
